Posts Tagged ‘Market Data’
September 2025: Monthly Market Updates from Sightlines

Each month consumer insights platform Sightlines will share one quick hit you can use to make confident decisions. Also, ACA members get 50% off a Sightlines subscription. Find the discount code in the Resource Hub.
Non-White Americans Increase as a Portion of Regular Drinkers
As debate continues around the meaning of a recent Gallup poll about alcohol consumption, updated government data offers additional context and nuance about who is and isn’t drinking.
The 2024 results of an annual survey by the federal Substance Abuse and Mental Health Services Administration (SAMHSA) were released in late July, and offer further insight into which Americans are changing their relationships to alcohol. The high-level findings back up what the Gallup poll found: Broadly, a lower percentage of Americans report past-month alcohol use in 2024 compared to the year prior. Yet the demographic shifts within this paint a more nuanced picture.
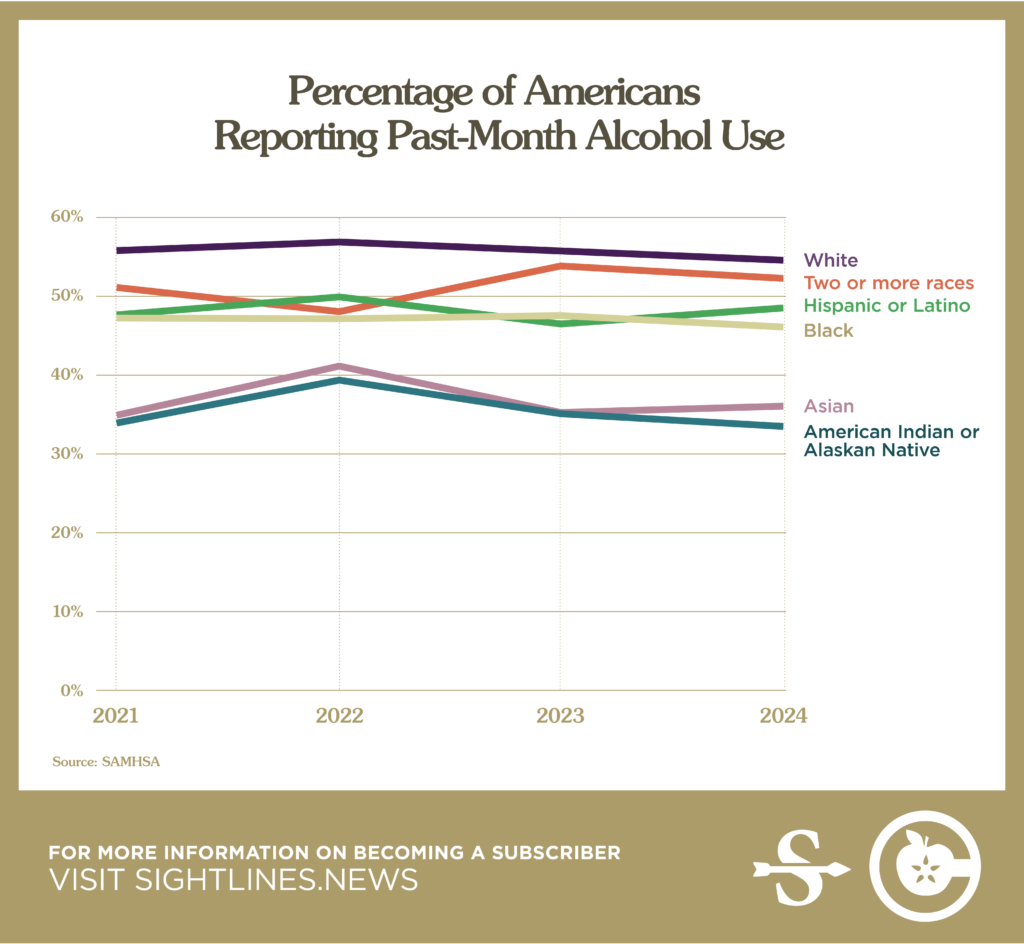
Drawing on both the Gallup poll and SAMHSA data, we see that declines in alcohol use are steepest among young, White, Republican-leaning men. Meanwhile, Hispanic and Asian drinkers show upticks in past-month drinking compared to 2021.
Those increases are especially notable given that 2021 was still well within the era of COVID-induced at-home indulgence. That some groups of Americans report increased rates of past-month alcohol use compared to that time is remarkable.
What does this mean for cidermakers? Non-white women are the future of alcohol consumption in the U.S., and that future is coming quickly. Women and Hispanic drinkers in particular are increasing as a share of regular drinkers at the same time that white men are driving declines. It’s not just about marketing to these more diverse drinkers, it’s about centering their voices and preferences.
Coffee Chat with 3 Tier Beverages

Are you curious about the latest trends in the cider industry? Join us for a members-only Coffee Chat webinar on January 9, 2024, at 10:00 AM Pacific Time, where Mary Mills and Julia Lechleiter from 3 Tier Beverages will share insights on 2023 chainr retail cider sales and consumer behavior.
The duo will provide a comprehensive analysis of the top 100 US cideries, off-premise growth, and regional insights based on data from NielsenIQ. With their expertise in the beverage industry, Mary and Julia will identify the drivers of growth and highlight emerging trends in the cider market at the chain retail level.
But the conversation doesn’t end there! Continue the discussion with 3 Tier Beverages at CiderCon® 2024 on Thursday, January 18 at 10:30 AM. This session will be co-led with our partners at CGA, a leader in on-premise data, and 3 Tier Beverages, a BevAl focused consultancy.
Don’t miss out on this exclusive opportunity to learn from industry experts and gain insights that can help your business thrive in the cider market. Register now for the Coffee Chat webinar and CiderCon® 2024 to stay ahead of the curve.
New On Premise Data for ACA Members!

Nationally Cider is up 3.3% in On Premise channels for the 52 week period ending April 23, 2023.
That’s right! On Premise data is back! We have renewed our partnership with CGA by NIQ OPM to bring our members helpful insights about On Premise cider trends. Drill down by Chain or Independent establishments, by 6 major urban markets, by national/regional brands, and by draft/package. Compare current trends to data from the last couple years to see growth and opportunities.
You must be an active ACA member to view this data. Not a member? Join now! Need to renew your membership. Renew here!
Fresh Data Insights Found in Latest Members-Only Cider Market Dashboard

For the lastest 13 week period through May 20, 2023, regional cider brand sales were up 7.2% YOY per NIQ.
Cideries use data talking points like this to make decisions and to pitch retailers, investors and wholesalers. But good data is hard to find and can be cost prohibitive. We have some good news for you though. Cider market data is included in your membership with the American Cider Association–what a great benefit!
The latest 3 Tier Beverages dashboard is now available to ACA members with data current as of May 20, 2023. Explore recent off-premise cider sales trends by state, packaging, style and more.
3 Tier Beverages, in partnership with NIQ, is proud to be the official data supplier of the American Cider Association. Part of this partnership brings you quarterly dashboards with key market data and insights to help you drive your business forward. Should you be interested in more detail on your brands/markets, please reach out to Mary Mills at 3 Tier Beverages.
If you missed our dashboard orientation webinar, you can watch it here.
In addition, there is a Glossary of Attributes available to help you understand the terms used as you progress through the data. You can download the glossary here.
Looking for data for previous time periods? Access our Cider Reports Library here.
We are data nerds here at ACA so please feel free to reach out if you have any questions.
New Item Coding for UPCs with NIQ


We want to make sure your cider is accounted for in national sales data. It’s important every cider is included so we can have an accurate picture of the cider industry and collect data that you can use when pitching your ciders to wholesalers and retailers around the country.
Please find below detailed instructions for how to submit new products to NIQ (formerly Nielsen).
To get NEW UPCs added:
- Fill out the NPC 2023 Form.
- Send both the form and correct photos (see below for photo guidelines) to Mary Mills at 3 Tier Beverages and she and her team will make sure everything is good to go for NIQ. She recommends uploading images to a shared drive (Dropbox or Google Drive) in order to preserve image quality.
Photo Guidelines:
Below is an in-depth photo guideline to follow when submitting photos to NIQ to get new UPCs coded or current ones updated.
Nielsen accepts 2 types of photos:
- 3D: Photos of the real 3D item.
- Flat: 2D photos of the label/box.
Nielsen is VERY PARTICULAR about the photos needed so below are the guidelines to follow. The images needed are described below, flat photos are best if you have them. If not, please send images of the actual item. For either type of photos you choose to submit, Nielsen requires photos of:
- Clear images of all 6 sides, including top & bottom of the individual product
- Clear images of all 6 sides, including top & bottom of the packs (2/4/6/12pk/etc) are needed if they are not sold individually
- Make sure photos are in jpeg format or else they will NOT be accepted
- They need to be clear, have a neutral background, and high resolution so no blurring when zoomed in
- Professional photos are not required
Click here to view photo examples for both 3-D and Flat.
Have questions? Email our NIQ contact Ryan Sisto.
A Few Tips for Getting the Most Out of Cider Market Data
We’re excited by the prospect of being able to provide both on-premises and off-premises syndicated data through our partnership with CGA & Nielsen IQ. With access to this data being a newer feature of ACA membership, we thought it prudent to go over a few concepts related to on and off-prem syndicated data.
Both on and off-prem sales statistics are measured using similar metrics including both dollars of cider sold and volume of cider sold. It’s important to remember that syndicated sales data such as this measures transactions from the retailer sold to the customer, not from the producer sold to the wholesaler or the wholesaler sold to the retailer. This data is always extrapolated from a smaller sample size to represent the larger market, so often the data is not an exact metric, but rather a gauge on overall trends.
In on-prem, this data represents sales from customers buying cider from bars, restaurants and venues. In the off-prem this data represents sales from customers buying cider at grocery stores, convenience stores and liquor stores. At first glance, the on-prem dollar sales are larger than off-prem sales for the trailing 52 weeks leading us to believe that the on-premises is where the majority of cider revenue is coming from. However, on-prem retailers sell our ciders at a very different price per gallon to their customers than do grocery stores. If you compare the volume of cider sold through on and off-prem, you can see that off-prem sells more than twice the volume as on-prem. Both on and off-prem data measures the volume of cider sold in Case Equivalents (24x12oz or 288oz). Syndicated data uses these case equivalents so that we can more easily compare volumes of cider sold regardless of whether sold in a keg or a can.
Be careful when comparing data between on and off-premises as both can be useful but it can be misleading if compared directly to one another without context and analysis. We hope this helps you to make better use of the data newly available to us.
You can find the on and off-premise data in our Resource Hub.
You must be an active ACA member to view the data. Not an ACA member? Join now!
Nielsen Q1 2023 Data Now Available!


This content is for members only.
If you were a member and are now seeing this message, please Renew your membership to continue.
New Benefits and Webinar with 3 Tier Beverages

The American Cider Association is dedicated to providing our members with valuable data they need to pitch retailers, investors and distributors. We are thrilled to announce an expansion of our data benefits through our new partnership with 3 Tier Beverages. The new dashboards will give the user more control over how you view the Nielsen data, offer you options for more comparisons, and provide insights on more regional markets—we’re excited to share that the dashboards will now include data for 50 markets! We’re finalizing the customization of the dashboards with 3 Tier, but they will be available to all ACA members very soon. This is just one area we are expanding our data benefits, and we hope you join the webinar to learn more about the 3 Tier custom dashboards for ACA members. Learn more about the webinar below.

3 Tier Beverages, in partnership with NielsenIQ, is proud to be the official data supplier of the American Cider Association. Part of this partnership brings ACA members quarterly dashboards with key market data and insights to help you drive your business forward. This webinar will walk ACA members through these dashboards so you can make the most of this unique offering. This webinar is for active ACA members only.
About Our Speakers

Mary Mills joined 3 Tier Beverages in 2022 from NielsenIQ, where she spent 14 years across client management, business development, and innovation insights. She has experience working with various clients in the food, beverage, and consumer goods industries, with 9 years focused on alcohol specifically. She holds a Marketing degree from The Ohio State University and is an avid Buckeye fan. She resides in Columbus, Ohio with her husband Andy and two children, Luke (4 years old) and Ava (2 years old).

Joe Sepka began his career in the CPG industry a little over a decade ago with PepsiCo as a contract pricing analyst for raw ingredients. Over the next few years, he grew into a variety of data-intensive roles. In 2018 however Joe was ready for a change and made the decision to leave PepsiCo for a new role at Revolution Brewing managing the data department. This was where he discovered he had a particular passion and love for the Bev-Alc side of the CPG industry. In 2020, Joe made the decision to leave Revolution to help launch 3 Tier Beverages. Each day he leverages my passion for data to assist their clients to find new opportunities in their respective Bev-Alc spaces, and help “level the playing field” when competing for space against the big guys.
In addition to being data-obsessed, Joe enjoys hikes, playing chess, recording music, and above all spending time with his wife Rosy, son Arthur, and (sometimes) grumpy but loveable dog Albus.
Nielsen Q3 2022 Data Now Available


Regional Cider Brand sales were up 11.3% in U.S. retail channels measured by Nielsen for the 12-week period ending on October 1, 2022. For more Q3 data, log into your ACA membership account and visit our members-only report library.
New On Premise Data Reports from CGA

CGA has taken a deeper look at consumers’ recent behavior when it comes to On Premise beverage purchases. They shared these highlights of their recent research:
- On Premise visitation remains relatively static
- 33% are spending more per visit to a bar or restaurant vs. 18% spending less than they were three months ago – price increases have driven the increased spend
- Two in five expect to have to cut back on their future On Premise visits due to cost of living increases
It’s clear that inflation and lingering impacts of the pandemic are having an effect, but the good news is that 9% of bar and restaurant consumers reported cider as their beverage of choice in the last 3 months. Learn more with these reports from our partners at CGA.
Webinar: BeerBoard’s Hard Cider Trends

BeerBoard’s Hard Cider Trends Webinar February 22, 2022
Join Dillon Card and Jim Randall from BeerBoard for the newest on-premise insights for cider with national and regional breakdowns, including competitive style and product performance data. This webinar will take place Tuesday, February 22, 2022 at 12:00pm Pacific on Zoom. Zoom link will be provided the day before the webinar.
This webinar is for active ACA members only. Join now or renew your membership!
Q2 Nielsen Reports Ready For Download
One of the perks of combining our buying power as an association is that we can share valuable insights from Nielsen with you, our members.
You can now download our custom Q2 reports. In this data packet you will be able to access:
- Off-Premise Micro-Reports broken down for packaging type, flavor, and region–14 states and 6 regional outlooks. Available in both a 12-week and a 52-week outlook.
- Off-Premise Macro-Reports for Beer, FMBs and Cider. Available in both a 12-week and a 52-week outlook.
- On-Premise Reports for 6 metro markets.
- Nielsen PPT slide decks with charts, data visualization and insights on the cider category’s recent performance in both On- and Off-Premise.
- Bonus this quarter: Hard Seltzer off-premise report.
Here is an excerpt from a recent Nielsen survey about current overall consumer sentiment:
CONSUMER SENTIMENT REPORT SUMMARY BY NIELSEN
“Here are some high-level findings from a Nielsen survey of 18K+ consumers, fielded July 1-8, 2020.
- Since June, we have started to see some consistent trends not only for off premise alcohol, but also across many consumer good categories. That comes to life in consumer sentiment as well. 60% of households expect their routines to remain altered for at least the next 4 months
- Nielsen has shared insights in the past in several forms about how premiumization within off premise alcohol isn’t slowing down, and has in fact accelerated during COVID weeks. However, when it comes to total consumer goods, we are starting to see more cautious consumer sentiment in relation to spending. Approximately 4 in 10 (42%) of households say they are watching what they spend as a result of COVID.
- The homebody economy continues. When asked what % of time households eat meals or snacks at home versus outside of home, 39% of households said they ate 100% of their meals and snacks at home. An equal amount (39%) said they ate outside of their home only 10% of the time. As a comparison, when asked what their habits were prior to COVID, only 12% said they ate all of their meals at home.
- When asked what their plans are for the coming months, close to 1 in 3 households (28%) said they plan to eat all of their meals at home. That of course was lower for younger consumers age 21-34, and much higher for consumers age 65+.
- What about consumer plans if economic conditions get worse (recession and/or inflation)? When asked about things they would do to save money when shopping for beer or wine, 39% said they won’t change how they shop for it. However, nearly ¼ said they would buy less. That’s a slightly different story for households with lower income (<$30K), which said they would be more likely to stop buying it all together.”
The Cider Rebound: Now, Let’s Keep It Going!
A recap of Nielsen’s keynote presentation at CiderCon 2019 in Chicago.
For the last three years we’ve been honored to have our partners at Nielsen present on the state of the cider industry during CiderCon’s opening session. They offer many of our members individual services, but we work with Nielsen to bring our members broad analysis that can help you with business pursuits and decisions. We are grateful for our partnership with Nielsen, and we hope that you will make sure you’ve sent them your labels and UPCs to enhance the value of this partnership.
We wanted to give you a quick recap of the points they delivered a week ago today. You can download their slides here: Nielsen Pres’n at CiderCon 2019_2-7-2019.
- Total off-premise (aka retail) sales were up 8.4% for the cider category in 2018.
- The category did over $500 million in off-premise sales last year.
- Cider retail sales dollars are 10x bigger today than 10 years ago.
- 40% of cider drinkers are between the ages of 21 and 29.
- Cider is the most gender balanced alcohol category, with 51% of drinkers being male and 49% of drinkers being female.
- Cider grew faster than beer, wine or spirits last year. Cider was edged out by Flavored Malt Beverage (FMB) growth, however.
- Cider is growing, but is still less that 1% of alcoholic beverage market share.
- The National Beer Wholesaler Association’s “Beer Purchasing Index” survey shows cider is an expanding segment with respect to distributor purchasing orders.
- Cider conversations online grew 11%–more than craft beer and alcoholic beverage category as a whole.
- Cider’s growth was led by nationally distributed rosé ciders (chiefly Angry Orchard and Crispin) and by regional/local brands.
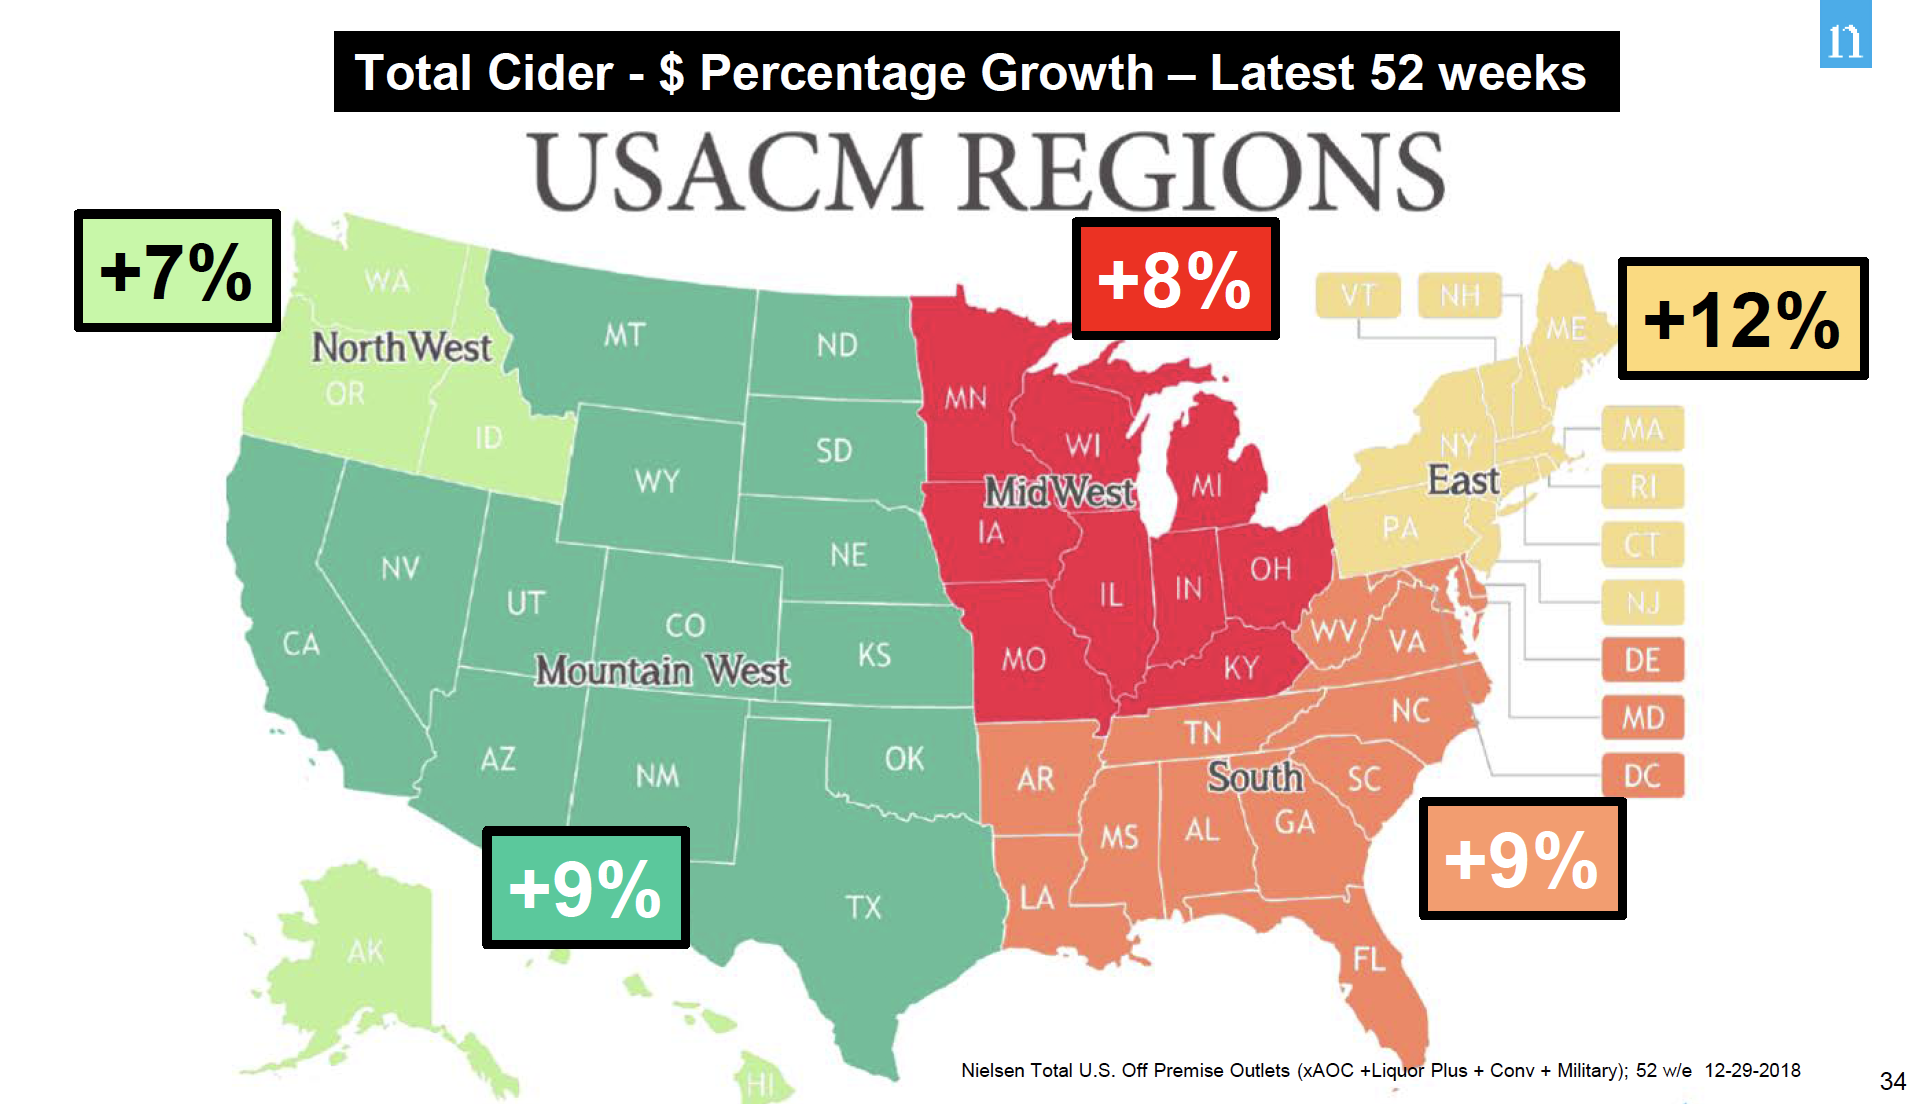
- All 5 of American Cider Association’s geographical regions experienced positive growth in cider sales for 2018 (off-premise).
- Regional and local cider retail sales increased 23% in 2018 (local craft beer increased 9.3% in 2018).
- 23 brands exceed the $1MM retail sales mark AND had double digit gains in 2018.
- Regional/local cider is now 1/3 of cider retail sales.
- Off the top 25 cider brands, 17 of them are regional or local brands.
- Cider’s total sales rely more heavily on on-premise sales that the other sectors, which are all about 50/50 on/off-premise.
- On-Premise retail sales were down across the board for cider: draft/packaged, national/regional.
- Some growth was seen for citrus, stone fruit and fruit-combo flavored ciders.
- Cider sales are 4.5X larger than FMB sales in on-premise
- Cider drinkers visit on-premise establishments more often than beer drinkers, and cider drinkers spend more money.
- Nearly a quarter of cocktail drinkers age 21-34 report drinking cider cocktails.
- Cider share of Beer/FMB/Cider today (Off plus On Premise) is 1.6%today (dollars)
Nielsen closed with this challenge: What If Cider’s Share of Beer in U.S. increases by 1 point? U.S. Cider sales would increase +65%, (over $800MM more than today).
Contact speaker Danny Brager (danny.brager@nielsen.com) with your questions or to submit your labels for their database.
As a American Cider Association membership benefit, detailed Q1-Q3 on- and off-premise reports are available for just $50 per quarter. Contact Ellen@ciderassociation.org if you’d like to purchase any of these today. Q4 will be available shortly, to be followed by our annual report on the cider market.