Market Data
The Year in Cider from Feel Goods Insights

Each month consumer insights platform Sightlines will share one quick hit you can use to make confident decisions. Also, ACA members get 50% off a Sightlines subscription. Find the discount code in the Resource Hub.
Off-Premise
Cider was a quiet standout among alcohol categories this year. At a time when nearly every subset of the industry struggled—from high-end spirits to wine to craft beer—cider posted positive volume growth in the off-premise, with convenience stores representing an especially strong channel. Cider volume was up +1.7% in the off-premise through the end of November, according to Nielsen multioutlet and convenience store data, while dollar sales were up +2% in those aggregate stores. In convenience stores, cider dollar sales rose even higher, up +6%. The on-premise picture was less rosy, however cider still outperformed some other segments. Given signs of acceleration in the waning months of the year, cider is poised to enter 2026 on relatively strong footing.
The takeaway: As other categories like hard seltzer and craft beer decline, cider is showing signs of long-term resilience in flavor-forward spaces. Imperial, flavored, and single-serve cider have helped the category make continued inroads in convenience stores. The challenge ahead is to maintain momentum as c-store points of distribution fill in.
Beer Purchasers Index (BPI)
The National Beer Wholesalers Association’s forward-looking Beer Purchasers Index (BPI) for November—the most recent month for which data is available—shows cider as the lone category that wholesalers feel more optimistic about than they did in 2024. The November 2025 BPI reading of 41 also marks the first time in five years that cider has enjoyed a BPI over 40. That’s a bright spot; however, a BPI less than 50 still indicates a category in contraction, as wholesalers anticipate purchasing less of it compared to the year prior.
The takeaway: Cider has a compelling story to tell its wholesale and retail partners right now. Message around these wins (or, in some cases, its strength relative to other categories’ losses). There’s data to support an argument that certain flavored cider brands deserve coveted display space alongside ready-to-drink cocktails. Retailers might be willing to swap in cider at a time when flavored malt beverages and hard seltzers are cooling.
On-Premise
The on-premise, however, offers less positive numbers for cider. Volumes fell -9% over the past 52 weeks, according to NIQ, with those losses accelerating in the last 12 weeks. As with chain retail, other categories such as craft beer and hard seltzer suffered steeper declines, so cider held its volume share of the beer category (1%) on-premise. Dollar sales showed similar trendlines.
The takeaway: In a world where on-premise placements are still limited to a single draft handle or a few cooler spots, cider isn’t able to maximize on the strength of its flavor variety the way it does on retailers shelves. But it’s still an environment where cider isn’t ceding ground. Flavored malt beverages, craft beer, and hard seltzers all saw steeper volume declines this year than cider, meaning cider can potentially capture a portion of those drinkers looking for seasonal and fruit-forward offerings.
C-Store Cider Sales Thrive This Year
Each month consumer insights platform Sightlines will share one quick hit you can use to make confident decisions. Also, ACA members get 50% off a Sightlines subscription. Find the discount code in the Resource Hub.
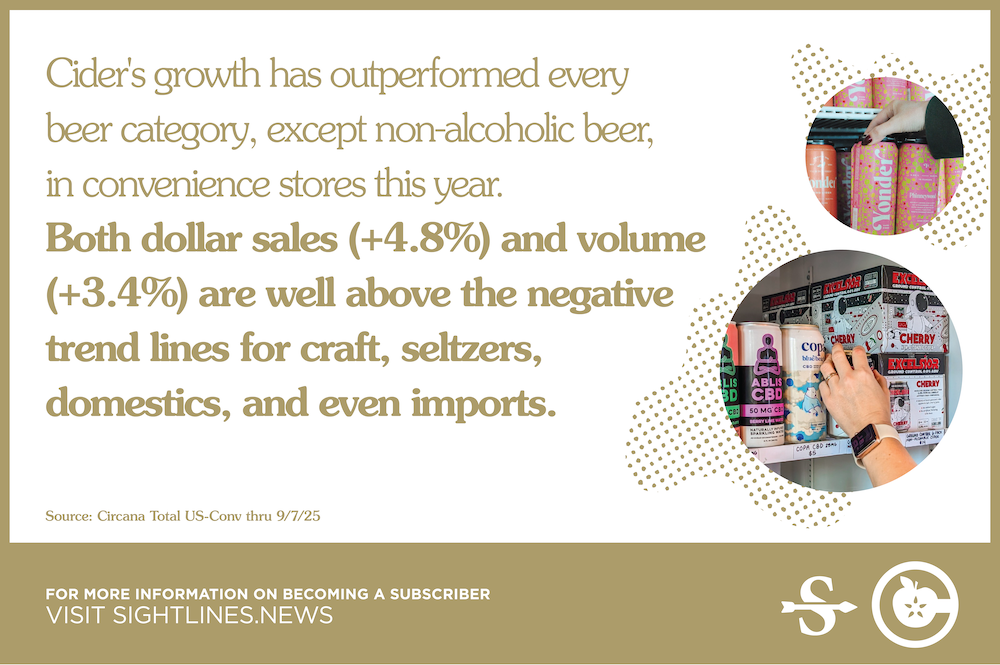
While alcohol has generally been in the red in most retail channels this year, cider sales in convenience stores offer a rare bright spot. Both dollar sales (+4.8%) and volume (+3.4%) are well above the negative trend lines for craft, seltzers, domestics, and even imports in Circana-tracked c-store data.
What explains the boom? Cider has finally arrived at the imperial party. In January, the Alcohol and Tobacco Tax and Trade Bureau (TTB) approved new standards of fill for higher-ABV cider that included 16 oz. and 19.2 oz cans. Prior to that update, those can sizes were only an option for cider under 7% ABV, excluding higher-strength cider from the single-serve can sizes that have proven so successful for imperial IPAs and high-gravity FMBs. At the time of the announcement, Jeff Parrish, co-owner of Oregon’s Portland Cider Company, called the move “a game changer,” and year-to-date sales confirm it.
But imperial cider in 19.2 oz. cans isn’t the only story line. Convenience stores’ craft beer SKU rationalization over the past year has also opened up space for higher-margin cider. And finally, cider enjoys crossover appeal with the popular RTD cocktail category—yet it may be available in c-stores where distilled spirits aren’t legally allowed. All of this presents a long runway for cider, which has yet to post numbers for October (National Cider Month), November (Thanksgiving), and December (Christmas and New Year’s Eve). We’d expect it to take an even bigger bite of the c-store apple in those final 2025 months.
September 2025: Monthly Market Updates from Sightlines

Each month consumer insights platform Sightlines will share one quick hit you can use to make confident decisions. Also, ACA members get 50% off a Sightlines subscription. Find the discount code in the Resource Hub.
Non-White Americans Increase as a Portion of Regular Drinkers
As debate continues around the meaning of a recent Gallup poll about alcohol consumption, updated government data offers additional context and nuance about who is and isn’t drinking.
The 2024 results of an annual survey by the federal Substance Abuse and Mental Health Services Administration (SAMHSA) were released in late July, and offer further insight into which Americans are changing their relationships to alcohol. The high-level findings back up what the Gallup poll found: Broadly, a lower percentage of Americans report past-month alcohol use in 2024 compared to the year prior. Yet the demographic shifts within this paint a more nuanced picture.
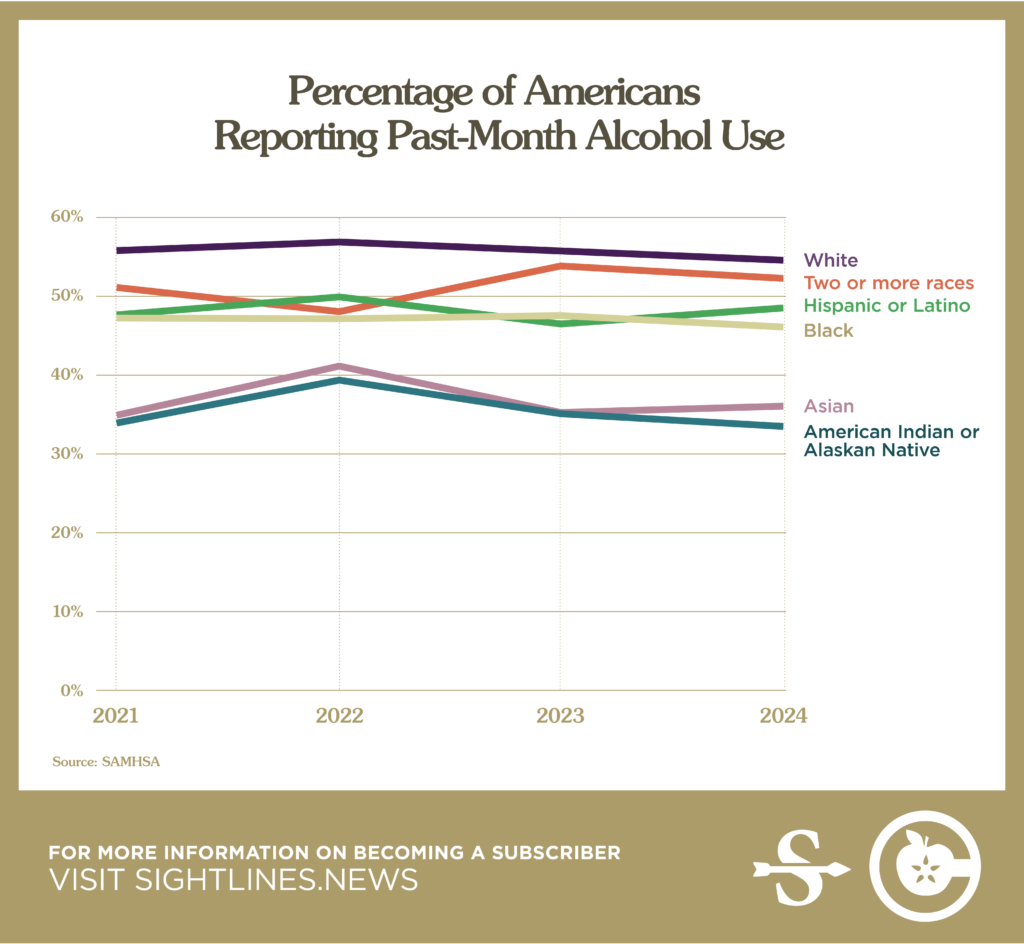
Drawing on both the Gallup poll and SAMHSA data, we see that declines in alcohol use are steepest among young, White, Republican-leaning men. Meanwhile, Hispanic and Asian drinkers show upticks in past-month drinking compared to 2021.
Those increases are especially notable given that 2021 was still well within the era of COVID-induced at-home indulgence. That some groups of Americans report increased rates of past-month alcohol use compared to that time is remarkable.
What does this mean for cidermakers? Non-white women are the future of alcohol consumption in the U.S., and that future is coming quickly. Women and Hispanic drinkers in particular are increasing as a share of regular drinkers at the same time that white men are driving declines. It’s not just about marketing to these more diverse drinkers, it’s about centering their voices and preferences.
August 2025: Monthly Market Updates from Sightlines

Each month consumer insights platform Sightlines will share one quick hit you can use to make confident decisions. Also, ACA members get 50% off a Sightlines subscription. Find the discount code in the Resource Hub.
Non-alcoholic sparkling wines thrive on attributes that are driving other adult beverage trends: ease, versatility, and indulgence. Cidermakers are well poised to deliver on these, too—perhaps even through non-alcoholic offerings.
In a year when overall wine sales are at their lowest point in three decades, Circana data shows sales of non-alcoholic sparkling wines have increased +60%. The niche is poised for even further growth in the near future as best-selling Josh Cellars takes its zero-proof sparkling wine from limited-release markets to national sales this summer.
What explains the boom in booze-free bubbles? They’re easy to understand and versatile to use. Unlike alcohol-free spirits such as Seedlip or wine alternatives like Proxi, they’re not asking drinkers to understand flavors and ingredients built from the ground up—they’re just sparkling wine, sans booze.
Non-alc cider can play a similar role. Like NA prosecco, it can offer a sense of celebration for people and occasions when alcohol might not feel appropriate: daytime office parties, baby showers, or high school graduations. It can be mixed with syrups or garnishes to create zero-proof cocktails, yet it’s still something people can easily grasp. Whether in your tasting room or at events, non-alc bubbles—from grapes or apples—could be a sophisticated but approachable choice for people and occasions where alcohol doesn’t fit.
July 2025 Market Insights from Sightlines: Cross-Category Insights You Can Use


Each month, consumer insights platform Sightlines will share one quick hit you can use to make confident decisions. Remember, ACA members get 50% off a Sightlines subscription. Find the discount code in the Resource Hub.
Getting Creative With On-Premise Sales Channels
No doubt the on-premise is a critical sales lane for cider—that’s nothing new. But thinking about that stalwart channel through the lens of other categories like wine or non-alcoholic beer can unlock creative opportunities.
Craft brewery taprooms and spirits tasting rooms offer one example. These establishments tend to specialize in one type of alcohol—but drinkers are increasingly demanding more variety. It opens up space for cidermakers to place their products in other manufacturers’ spaces, helping them fill gaps without having to make the liquid themselves.
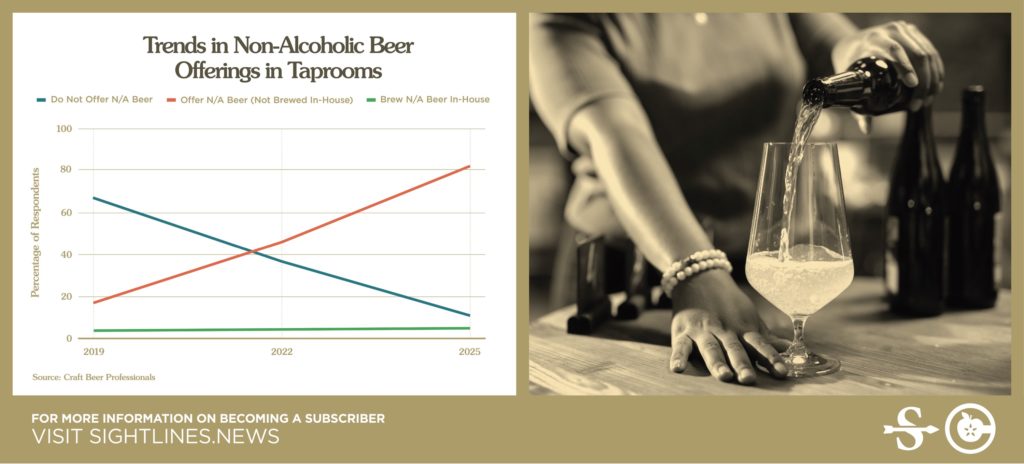
It’s something non-alcoholic beer brands have been able to capitalize on: A Craft Beer Professionals survey, conducted this April, found that small breweries are 370% more likely to say they’re offering a non-alcoholic beer made by another company than they were just six years ago. This makes sense. Members of Craft Beer Professionals are small breweries; 63% produce less than 500 barrels of beer annually. They likely don’t have the capacity, expertise, or equipment to make quality NA beer (or cider) on-site. Yet they recognize these are beverages drinkers have come to expect in 2025. This can extend to beer bars or distilleries as well, with a myriad of benefits for a cidermaker that go beyond sales.
Offering packaged or draft options from another producer has benefits for both the retailer and the “guest” brand:
- The on-premise account attracts a larger set of customers, particularly those in group occasions. Show us a group of six friends in which at least one person doesn’t like or can’t tolerate a given type of alcohol.
- Management can observe the ordering behavior of a more diverse set of drinkers—not just their existing, dedicated fans.
- For suppliers of the “guest” brand being served, the taproom is a place to gain consumer traction. It’s an ideal environment to win a new cider drinker with an educated staff and a vibrant social setting. Your cider brand might be one of 15 on the grocery shelf, but it could be the sole option at a brewery’s taproom.
But cider can extend this thinking beyond mere taprooms, beer bars, and distilleries. Thinking like another category might open unique on-premise angles: A spirits brand is often eager to be used in a signature cocktail, for example. Why not the same for a cider spritz? Wine brands strive to be recommended by the glass as a pairing with a particular dish; again, why not the same for a cider?
Cribbing strategies from other categories is a fresh way to approach on-premise accounts with creative ideas—and to win new drinkers.
January 30: The Future of Hard Cider: Innovation and Market Trends for the Top Producers


Description:
Join us for an ACA member exclusive webinar hosted by 3-Tier Beverages in partnership with the American Cider Association. This event will take a deep dive into the performance of the top hard cider producers over the past year, providing key insights into how leading cider brands have navigated the ever-evolving bev-alc market and what strategies they’ve employed to achieve growth and success.
What to Expect:
- Market Performance Analysis: Get an in-depth analysis of year-over-year sales trends, market share, and overall growth of the top hard cider producers.
- Key Industry Trends: Discover emerging trends and consumer preferences that have shaped the hard cider market, and the strategies top producers have implemented to stay ahead.
- Challenges and Opportunities: Understand the challenges faced by the industry and its ever shifting consumer demands. Learn how the leading brands have turned these challenges into opportunities.
- Innovation in Hard Cider: Explore how innovation, both in product types and methods of marketing, is driving the success of top cider makers. Learn about the latest cider varieties, and flavor innovations.
Help Shape the Future of Cider: Take the 2023 ACA Cider Production Survey

At the American Cider Association we work hard to support cider and cidermakers across the United States every day of the year, but we can’t do it without some help from you. We need to provide Congress, the media, and buyers with the most up-to-date and complete industry overview we possibly can. We are asking for you to assist us in collecting aggregated production information for the US cidery industry for 2023 so that we have the most accurate information to promote cider at all levels.
If you are licensed to make cider on a commercial basis we invite you to take our survey so we can gather information vital to promoting and protecting cider in the US.
Details:
- This survey will take about 30 minutes to complete.
- The survey is being aggregated and anonymized by a third party. They have agreed to not share information with us that might identify who you or your cidery are. YOUR PRIVACY MATTERS TO US.
- Your cidery name is collected by the 3rd party to ensure there are no duplicates, but the ACA will not store that information after the survey has been returned to us with identify features removed.
- We do ask a number of questions about sales, staffing and production for 2023. You will find it helpful to have that data handy before completing the survey.
- Note: If you produce wine or other beverages besides cider, please answer only considering your cider production.
- Deadline to complete the survey is December 13, 2024.
- Anyone who submits their completed survey and provides their contact info will be entered into a raffle to win an American Cider Association hoodie (4 available) and a grand prize winner will receive a complimentary ticket to CiderCon® 2025!
If you have any questions regarding this survey or how the data is used, please contact CEO of the American Cider Association Michelle McGrath.
We appreciate your help in allowing us to continue to promote cider across the United States!
August 22: Crafting Compelling Stories: The Role of Data in Your Brand’s Narrative


Join us August 22 at 11:00 AM Pacific for an insightful webinar hosted by the American Cider Association in partnership with 3-Tier Beverages, where we’ll explore how to transform raw data into compelling narratives that captivate your audience and elevate your cider brand.
In this session, you’ll learn:
- The Essentials of Data Storytelling: Discover the fundamentals of turning data into engaging stories that resonate with your customers and how you can differentiate your cider in a competitive market.
- Effective Data Analysis Techniques: Gain practical insights into analyzing and interpreting data from the ACA Member Dashboard to uncover meaningful trends and patterns that can inform your storytelling.
- Crafting Your Brand Narrative: Learn strategies for integrating data insights into your brand story to highlight your cider’s unique attributes and characteristics to connect with your target audience on a deeper level.
Whether you’re established or just starting out, this webinar will provide you with the tools and techniques needed to utilize the full potential of your data to tell the best story for You and Your Brand.
Speakers

Julia Lechleiter
Julia Lechleiter started out her career at 84.51 on their Insights team where she supported emerging CPG brands in leveraging Kroger household data to guide customer-focused assortment, promotion, innovation and digital strategies. After supporting clients on numerous new item presentations and being exposed to the power of BASES innovation research, she joined NIQ on the BASES BevAl team. While she learned to love the BevAl industry, she missed working in a data platform to support clients run various analyses, specifically those related to retailer relations which led her to 3 Tier. Julia graduated from Miami University with a degree in Marketing, and lives in Cincinnati, Ohio with her husband. They have a 1-year old son, John, and two cocker spaniels, Bailey and Phil.

Devon Hevener
Devon Hevener started out his career working in the culinary industry as the general manager for 5 years where he used data to better understand trends in the area to help the business grow from a single food cart to several carts and a brick and mortar. Most recently, he has spent the last year working with the American Cider Association as a Consumer and Market Data Research Intern where he was able to learn the industry firsthand through the mentorship of industry experts and various ad-hoc projects which helped connect him to 3-Tier. One of his most significant projects was the creation of a formal database of all cider producers within the United States. Devon graduated from Portland State University with a degree in Business Technology & Analytics and currently lives in the Portland, Oregon area with his wife Hannah.
Coffee Chat with 3 Tier Beverages

Are you curious about the latest trends in the cider industry? Join us for a members-only Coffee Chat webinar on January 9, 2024, at 10:00 AM Pacific Time, where Mary Mills and Julia Lechleiter from 3 Tier Beverages will share insights on 2023 chainr retail cider sales and consumer behavior.
The duo will provide a comprehensive analysis of the top 100 US cideries, off-premise growth, and regional insights based on data from NielsenIQ. With their expertise in the beverage industry, Mary and Julia will identify the drivers of growth and highlight emerging trends in the cider market at the chain retail level.
But the conversation doesn’t end there! Continue the discussion with 3 Tier Beverages at CiderCon® 2024 on Thursday, January 18 at 10:30 AM. This session will be co-led with our partners at CGA, a leader in on-premise data, and 3 Tier Beverages, a BevAl focused consultancy.
Don’t miss out on this exclusive opportunity to learn from industry experts and gain insights that can help your business thrive in the cider market. Register now for the Coffee Chat webinar and CiderCon® 2024 to stay ahead of the curve.
New On Premise Data for ACA Members!


Nationally Cider is up 3.3% in On Premise channels for the 52 week period ending April 23, 2023.
That’s right! On Premise data is back! We have renewed our partnership with CGA by NIQ OPM to bring our members helpful insights about On Premise cider trends. Drill down by Chain or Independent establishments, by 6 major urban markets, by national/regional brands, and by draft/package. Compare current trends to data from the last couple years to see growth and opportunities.
You must be an active ACA member to view this data. Not a member? Join now! Need to renew your membership. Renew here!
Fresh Data Insights Found in Latest Members-Only Cider Market Dashboard

For the lastest 13 week period through May 20, 2023, regional cider brand sales were up 7.2% YOY per NIQ.
Cideries use data talking points like this to make decisions and to pitch retailers, investors and wholesalers. But good data is hard to find and can be cost prohibitive. We have some good news for you though. Cider market data is included in your membership with the American Cider Association–what a great benefit!
The latest 3 Tier Beverages dashboard is now available to ACA members with data current as of May 20, 2023. Explore recent off-premise cider sales trends by state, packaging, style and more.
3 Tier Beverages, in partnership with NIQ, is proud to be the official data supplier of the American Cider Association. Part of this partnership brings you quarterly dashboards with key market data and insights to help you drive your business forward. Should you be interested in more detail on your brands/markets, please reach out to Mary Mills at 3 Tier Beverages.
If you missed our dashboard orientation webinar, you can watch it here.
In addition, there is a Glossary of Attributes available to help you understand the terms used as you progress through the data. You can download the glossary here.
Looking for data for previous time periods? Access our Cider Reports Library here.
We are data nerds here at ACA so please feel free to reach out if you have any questions.
How to Submit Your SKUs to Circana


We want to make sure your cider is accounted for in national sales data. It’s important that every cider is included so we can have an accurate picture of the cider industry and can collect data that you can use when pitching your ciders to wholesalers and retailers around the country. Please submit your new or updated SKUs to Circana today.
Please find below detailed instructions for how to submit new products to Circana (formerly IRI).
Work with your Client Service Consultant to submit image labels. If you are not a Circana client, send images directly to: DCA.ElectronicImage@circana.com.
Submission Guidelines
- New SKU – send images of packaging with UPC on the packaging; Circana does not accept images without clear UPCs.
- If an item is a seasonal/series/rotational, provide packaging with the multiple styles/flavors to Circana. If those packaging images are not available, provide a sell sheet or proof that there are multiple styles/flavors using the same UPC. If you want a specific series name included in the coding, please include the word “series” in the packaging name, otherwise Circana will code as seasonal.
- Image Requirements
- Multi-packs need either a flat-file package image, two images of the front and the side of the package containing the UPC, or a flattened carton to show both front and side with UPC.
- Multi-packs in snap ring/hicone (where individual can/bottle only option for scanning the multi-pack unit). Turn one can/bottle to show the front label and another to show the part with the UPC with both connected through the snap ring/hicone.
- Singles need either the flat-file package/label image or two images of the front and back of the container and a clear image of the UPC code.
- Change Coding on Existing SKUs – send images of packaging and details of attribute(s) you wish to change.
New Item Coding for UPCs with NIQ


We want to make sure your cider is accounted for in national sales data. It’s important every cider is included so we can have an accurate picture of the cider industry and collect data that you can use when pitching your ciders to wholesalers and retailers around the country.
Please find below detailed instructions for how to submit new products to NIQ (formerly Nielsen).
To get NEW UPCs added:
- Fill out the NPC 2023 Form.
- Send both the form and correct photos (see below for photo guidelines) to Mary Mills at 3 Tier Beverages and she and her team will make sure everything is good to go for NIQ. She recommends uploading images to a shared drive (Dropbox or Google Drive) in order to preserve image quality.
Photo Guidelines:
Below is an in-depth photo guideline to follow when submitting photos to NIQ to get new UPCs coded or current ones updated.
Nielsen accepts 2 types of photos:
- 3D: Photos of the real 3D item.
- Flat: 2D photos of the label/box.
Nielsen is VERY PARTICULAR about the photos needed so below are the guidelines to follow. The images needed are described below, flat photos are best if you have them. If not, please send images of the actual item. For either type of photos you choose to submit, Nielsen requires photos of:
- Clear images of all 6 sides, including top & bottom of the individual product
- Clear images of all 6 sides, including top & bottom of the packs (2/4/6/12pk/etc) are needed if they are not sold individually
- Make sure photos are in jpeg format or else they will NOT be accepted
- They need to be clear, have a neutral background, and high resolution so no blurring when zoomed in
- Professional photos are not required
Click here to view photo examples for both 3-D and Flat.
Have questions? Email our NIQ contact Ryan Sisto.
A Few Tips for Getting the Most Out of Cider Market Data
We’re excited by the prospect of being able to provide both on-premises and off-premises syndicated data through our partnership with CGA & Nielsen IQ. With access to this data being a newer feature of ACA membership, we thought it prudent to go over a few concepts related to on and off-prem syndicated data.
Both on and off-prem sales statistics are measured using similar metrics including both dollars of cider sold and volume of cider sold. It’s important to remember that syndicated sales data such as this measures transactions from the retailer sold to the customer, not from the producer sold to the wholesaler or the wholesaler sold to the retailer. This data is always extrapolated from a smaller sample size to represent the larger market, so often the data is not an exact metric, but rather a gauge on overall trends.
In on-prem, this data represents sales from customers buying cider from bars, restaurants and venues. In the off-prem this data represents sales from customers buying cider at grocery stores, convenience stores and liquor stores. At first glance, the on-prem dollar sales are larger than off-prem sales for the trailing 52 weeks leading us to believe that the on-premises is where the majority of cider revenue is coming from. However, on-prem retailers sell our ciders at a very different price per gallon to their customers than do grocery stores. If you compare the volume of cider sold through on and off-prem, you can see that off-prem sells more than twice the volume as on-prem. Both on and off-prem data measures the volume of cider sold in Case Equivalents (24x12oz or 288oz). Syndicated data uses these case equivalents so that we can more easily compare volumes of cider sold regardless of whether sold in a keg or a can.
Be careful when comparing data between on and off-premises as both can be useful but it can be misleading if compared directly to one another without context and analysis. We hope this helps you to make better use of the data newly available to us.
You can find the on and off-premise data in our Resource Hub.
You must be an active ACA member to view the data. Not an ACA member? Join now!
Nielsen Q1 2023 Data Now Available!


This content is for members only.
If you were a member and are now seeing this message, please Renew your membership to continue.
Webinar: The Story Within the Story of Cider

You’ve heard the headlines and the general trends for Cider. Join Brian “BK” Krueger and Dave Williams from Bump Williams Consulting on Tuesday, May 23, 2023 at 11:00 AM Pacific to dive in a little deeper and really take a look at the KPI’s that matter and how you can apply them to your own situation, presentations, insights, and decisions.
You can expect to hear more of the story on Cider Velocity, Runway for the Future, the Role of Flavor, Pack Size and Type, Innovation, Regional Power, and the Modern Bev Alc Consumer.
This webinar is for active ACA members only. Not a member? Join now!
Our Speakers

Brian “BK” Krueger graduated from the University of Texas, Austin in 1996 with a degree in Marketing – focusing on Strategic Marketing & Promotional Strategies. BK is a 24-year Industry Sales Leader with a distinguished and accomplished history of growth and development across multiple National and Regional Craft Breweries. Rising from New Belgium’s first “Texas Beer Ranger” in 1999, BK spent 17 years growing in parallel with New Belgium’s success and expansion and held the role of Assistant Director of Sales for 5+ Years. Leaving New Belgium in 2015, BK spent the next 4 years applying his knowledge, experience, and skill set to an extended selection of National and Regional Craft Breweries helping to evolve them into the modern and future world of Craft Beer. Joining Bump Williams Consulting in 2020, BK now applies his talents and expertise on Sales Systems and Structure, Portfolio Development, Distributor & Retailer Partnership, and Sales Strategy & Growth across the broad spectrum of Beverage Alcohol clients.

Dave Williams graduated from Penn State University in 2006 with a degree in Marketing. Dave began his career at Marketing Management Analytics (Ipsos MMA) as a Data Analyst, running sales regression models and market level analytics across various Retail and CPG clients. He left MMA and joined Nielsen in 2010, working up to the role of Client Manager. In this role, Dave led a team dedicated to Market Mix, Price/Promo and Consumer analysis for Procter & Gamble globally, spanning multiple categories and brands across their wide portfolio. In 2015, Dave left Nielsen to join Bump Williams Consulting where he currently runs high-end analytics across the Beverage Alcohol universe. His key focus areas include Consumer Behavior, Pricing, Promotion and Retail Landscape for BWC’s Supplier, Distributor and Retailer clients.
March 24 Coffee Chat with Vinoshipper


Join us March 24 at 9:30am for a Coffee Chat webinar with Vinoshipper!
Vinoshipper Senior Analyst Taylor Harrison will lead us through a look back at their data from 2022 and also provide a quick snap shot of what they’re seeing at the beginning of 2023 with regards to sales, packaging, and demographics!
Want to check out some of the data before Taylor’s presentation. You can download it here.
About Our Speaker

Taylor joined the alcohol industry directly out of college as in intern with Constellation Brands. Shortly after, he was awarded the ability to play lacrosse for Team England, so he moved to England, where he began working as a fine wine market analyst for the London International Vintners Exchange (Liv-Ex). During his summers, he would take time off to do vintage work at a winery in Surrey. Taylor joined Vinoshipper, from London, in 2021 and started up the data analytics program, offering insight into the craft alcohol industry. He continues to develop the division with the goal of helping producers make the most of their data and understand what is happening in the market.
Nielsen Q3 2022 Data Now Available


Regional Cider Brand sales were up 11.3% in U.S. retail channels measured by Nielsen for the 12-week period ending on October 1, 2022. For more Q3 data, log into your ACA membership account and visit our members-only report library.
New On Premise Data Reports from CGA

CGA has taken a deeper look at consumers’ recent behavior when it comes to On Premise beverage purchases. They shared these highlights of their recent research:
- On Premise visitation remains relatively static
- 33% are spending more per visit to a bar or restaurant vs. 18% spending less than they were three months ago – price increases have driven the increased spend
- Two in five expect to have to cut back on their future On Premise visits due to cost of living increases
It’s clear that inflation and lingering impacts of the pandemic are having an effect, but the good news is that 9% of bar and restaurant consumers reported cider as their beverage of choice in the last 3 months. Learn more with these reports from our partners at CGA.
Nielsen 2021 Data Insights Webinar

Nielsen 2021 Data Insights Webinar – April 27, 2022 at 11:00am Pacific
Join the ACA and Nielsen for a review of 2021 Off-Premise cider trends with Nielsen. Nielsen VP Jon Berg will share sales trends by packaging, flavor, style and region. We will also look at the insights provided by our newest report with Nielsen, a comparative consumer panel study. We’ll identify cider’s strengths and areas for growth regarding consumer demographics, and we’ll compare it to wine, beer, FMBs and cocktails.
About the Speaker
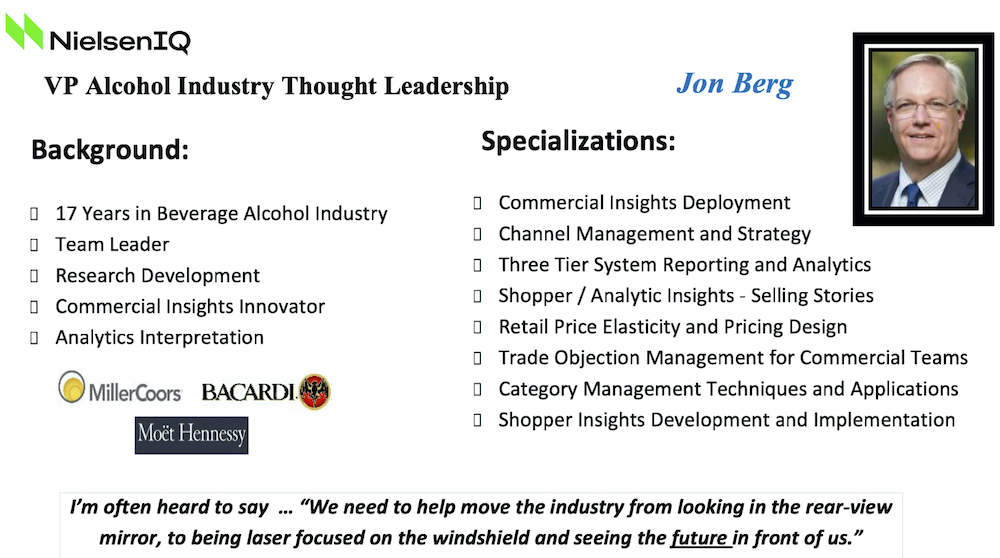
You must be an active ACA member to attend this webinar. You can join or renew your membership here.
Harvest Driven Cider Segment Survey Report Webinar
Join us March 1, 2022 at 12:00pm Pacific for analyses of the harvest driven cider segment of the cider industry. Harvest driven cider makers are defined as those for whom 75% of their annual cider production is are pressed once per year at or close to the date of harvest and are aged for a minimum of three months prior to packaging. Because this segment of the cider industry is often smaller producers who don’t sell in markets captured by Nielsen data or retail data scanner providers like IRI, the American Cider Association decided to launch an annual harvest driven cider survey. This inaugural survey was undertaken by Michael Uhrich of Seventh Point Analytic Consulting. He has taken a deep dive into the data to suss out the current status of the harvest driven cider segment and will present these results with us in this webinar.
This webinar is for ACA members only. You can log in, join, or renew your membership here.
Registration closes February 28, 2022 at 1:00pm Pacific. Information to join via Zoom will be sent after registration closes on February 28, 2022.
Webinar: BeerBoard’s Hard Cider Trends
BeerBoard’s Hard Cider Trends Webinar February 22, 2022
Join Dillon Card and Jim Randall from BeerBoard for the newest on-premise insights for cider with national and regional breakdowns, including competitive style and product performance data. This webinar will take place Tuesday, February 22, 2022 at 12:00pm Pacific on Zoom. Zoom link will be provided the day before the webinar.
This webinar is for active ACA members only. Join now or renew your membership!
Q3 Trends Available for Download


Q3 reports are available for download as part of your ACA membership benefits. Regional cider brand sales were up 11% for year over year comparisons of Nielsen-measured off-premise channels for the 52-week period ending with Q3. Total cider category sales for the 52-week period ending with Q3 were up 2% compared to 2019 and down 4% when compared to 2020 for Nielsen-measured off-premise channels. In on-premise channels, cider’s rebound for the 12-week period of Q3 compared to the same period for 2020 exceeded beer’s rebound for both draft and packaged sales. For more details on how the category is performing including regional and packaging analysis, download our members-only Nielsen reports after logging into our website.
Quarter 2: A Year After The Great Stockpile

Included in your benefits as an active member of the American Cider Association are quarterly market trend reports that break cider out into regions, packaging type, flavor, draft and more. Today we are releasing the Quarter 2 data provided through our partnership with Nielsen. Year over year comparisons for the second quarter of 2021 are not very helpful for most CPGs, because what were consumers doing in April, May and June of 2020? Stockpiling goods. Cider was no exception—according to Nielsen, retail sales of the total cider category were up 13.8% for Q2 of 2020 and regional cider brands were up a shocking 40%. So what can we say about Q2 of 2021 with the knowledge that Q2 2020 deserves an asterisk?
In Nielsen-measured retail channels:
- Regional brands of cider became the majority of cider’s market share in Q4 of 2020. That pattern persists in Q2 of 2021. These brands were only 25% of the market as recently as 2017.
- Regional cider brands are up 34.5% compared to Q2 of 2019. They are down slightly at -3.5% when compared to Q2 of 2020 which actually highlights what cider is best at: share preservation.
- Comparing YOY, regional cider brands are still positive for the trailing 52 weeks and will likely enjoy traditional Q3 seasonal growth.
- 6 packs of cans are the packaging type of choice for the moment.
- Flavors that are up for regional brands when compared to Q2 2019 include apple, pineapple, cherry, berry and sours, but the “other” flavor category is up 42% when compared to Q2 2019.
The data included in the Q2 packet compares to 2020. Keep that in mind when drawing your own conclusions. My conclusion is that cider is sustaining a big portion of the growth it saw in 2020 to preserve its share of the market. With regional cider brands comprising the majority of cider’s market share, we may start to see overall share growth in the context of the beverage alcohol segment.
Retailers who are taking cider off the shelf right now are missing a huge opportunity. Fall cider sets are a big winner—”From summer to fall of 2020, cider’s share of the beer category grew from 4.3 percent to 5.2 percent” (Drizly). I wonder what the increase is for regional cider? Probably much greater.
There is a lot of discussion of “nostalgic” flavors at the moment. This may be a chance for cider to push apple-driven products as we see brands like Seattle Cider and Bold Rock doing.
As far as the return of on-premise? When on-premise came back on board last spring, all “beer” segments experienced growth. We learned from our webinar last month that cider had the greatest YOY growth of all the “beer” sub-segments (*Q2 volume share Nielsen 12w 2021). National cider brands lead the growth, with a 751% increase for drafts sales for Q2 YOY. Apple-driven ciders experienced the most growth of all the flavor segments.
Cider won’t quit.
For more information on regional, packaging and flavor trends, get the Q2 data package included in your membership.
BONUS: For a fun analysis of GLINTCAP winners in the fruit cider category, check out this blog from Old Orchard.
Download Nielsen 2021 Quarter 2 Reports
This content is for members only.
If you were a member and are now seeing this message, please Renew your membership to continue.
New ACA Member Benefit!

The American Cider Association is excited to announce a new partnership with Good Beer Hunting to bring you premium content from their Sightlines+ insights newsletter. Each week, their team combines data, analysis, and real-world experiences from across alcoholic beverage to help break down trends across categories that can help your business make decisions for the future. All ACA voting members will receive a 50% off a year membership to some of the best insights in the industry from writers like Bryan Roth and Kate Bernot. Login to your ACA account to find the code for your 50% discount.
Interested in learning a bit more about Sightlines? Check out these recent articles:
CIDER’S RESILIENCE STOOD TRUE THROUGH 2020

At the end of 2019, I argued that cider’s resilience through the “Summer of Hard Seltzer” was the real headline. I could not have possibly known that cider’s resilience through 2020 would swamp that achievement. 2020 challenged and changed alcohol beverage sales in the US with a rapid pace, and the cider industry was absolutely not immune. It goes without saying many of the forced changes were negative. On premise sales took a massive hit (-51.5% in Nielsen-measure on premise channels). It’s hard to argue that widespread closures of tasting rooms and restaurant accounts, ubiquitous employee layoffs, and anecdotal reduced supply purchases from local orchards were positive changes for the industry as a whole. However, it is true that some cider companies benefited from the market’s increased focus on retail due to the structure of their business models. It is meaningful to all cidermakers that in 2020 the cider category grew more than beer in the Nielsen-measured retail channels. What were some of the other positive outcomes?
We saw online sales for cider dramatically increase—for some producers, their 2020 online sales were as much as three times their 2019 sales. We know that local cidery customers rose to the challenge to order cider for curbside pickup and delivery, turning the previous conclusion that cider consumers are “explorers” with less brand loyalty on its head at the local level. Many of these changes required legislative emergency actions at the state level. Although there is a real fear that there will be push back against these changes long term, it is going to be hard to move the policies back to pre-Covid times. Convenience is King.
We also saw the category embrace rapid innovation and quickly adapt to new market conditions. This nimbleness allowed cider to hold onto its shares of the market. This happened despite growing perceived competition from flavored malt beverages and with completely different market conditions than what we saw in 2019.
As part of your American Cider Association membership benefits, we provide complimentary quarterly market trend reports which we commission Nielsen to produce. We look at the Quarter 4 reports to get an idea of how cider performed in chain retails and restaurants across the country for 2020. The reports break down trends by region, packaging and flavor.
Here are some of the major takeaways from cider’s off-premise performance in Nielsen-measured channels for Q4 of 2020:
- For the first time ever, sales of national cider brands (defined as those owned by larger beverage corporations) ceded their majority hold of the category’s shares. Regional brands accounted for 27% of cider’s dollar share in Q4 of 2017 and 51% of cider’s dollar share in 2020.
- Regional cider brands grew 33% in Quarter 4 of 2020 to help achieve this.
- Not surprisingly, canned cider sales grew 19%, with 6-packs, 4-packs, and single cans contributing the most to that growth.
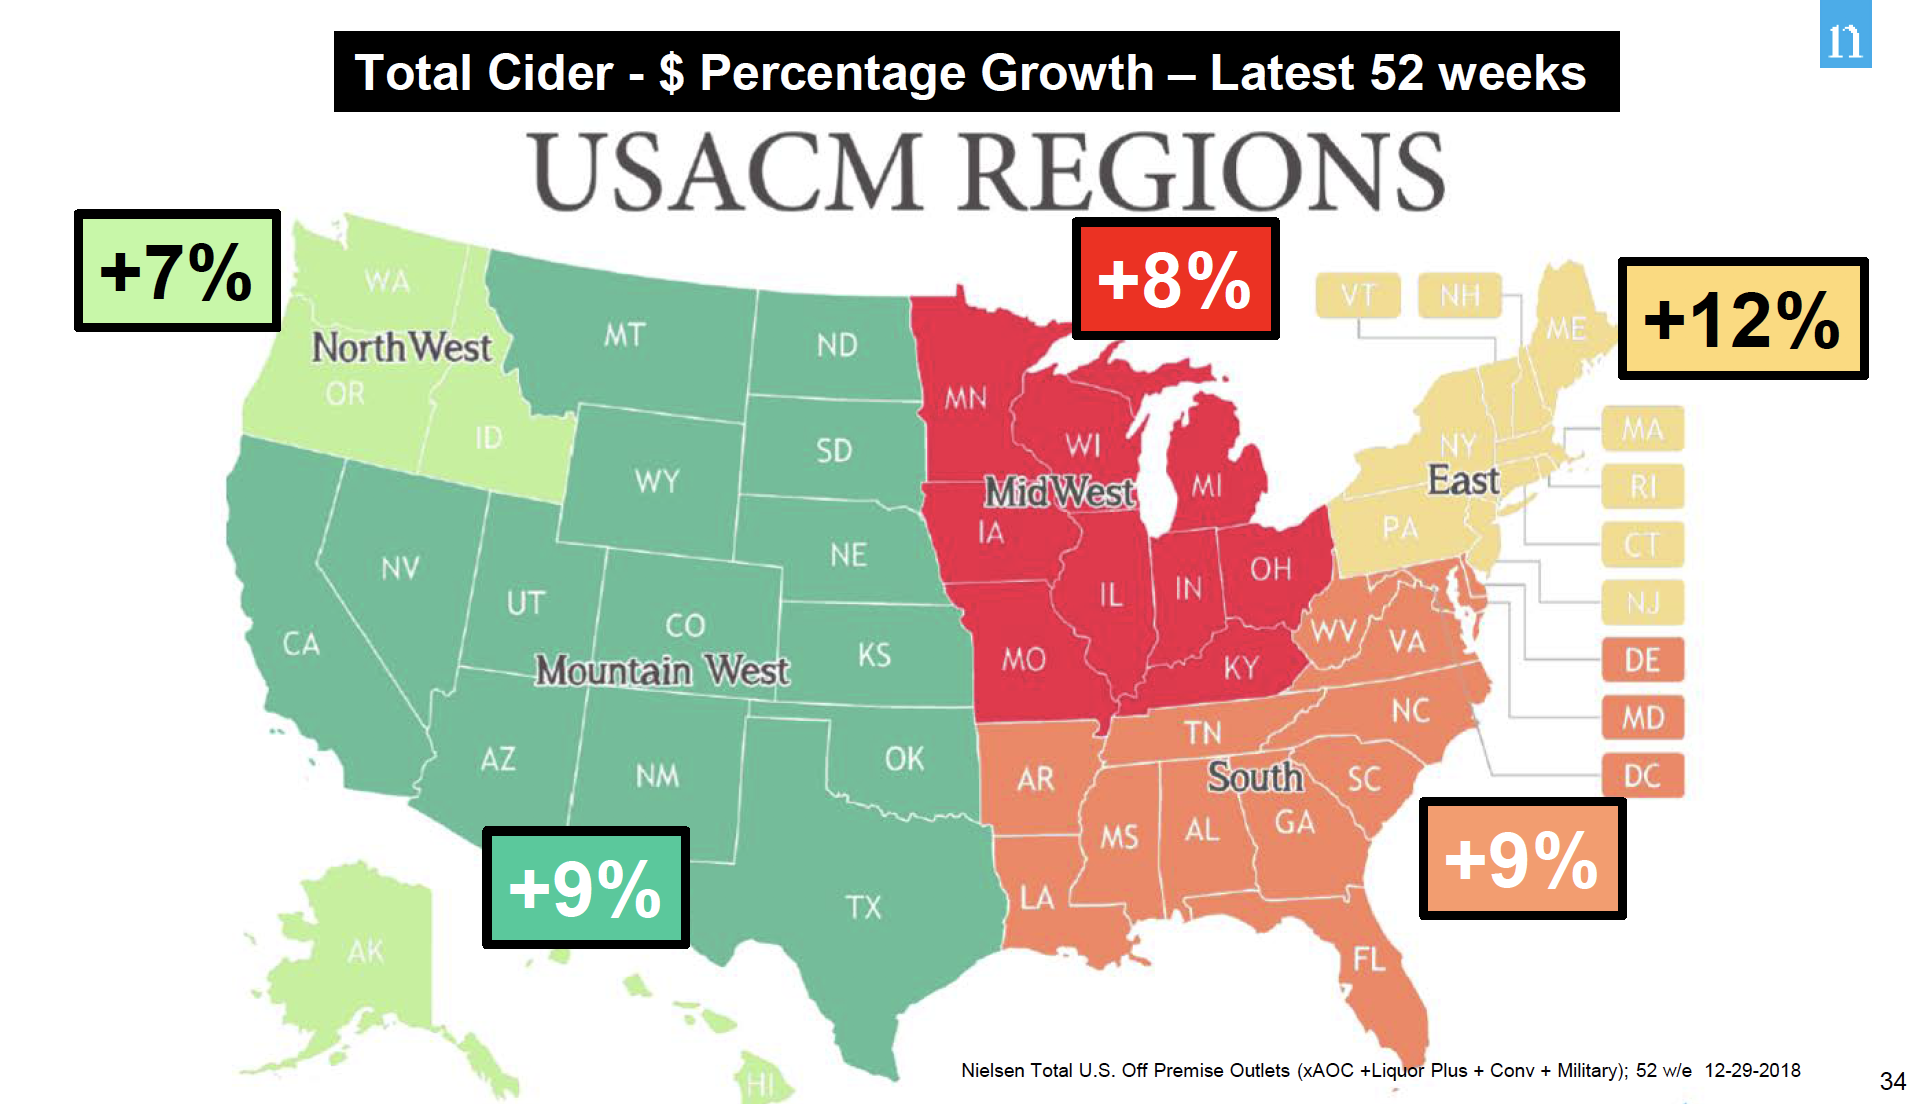
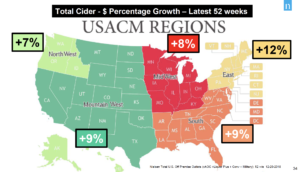
- The top three performing cider-regions from a total-cider perspective were the Northwest ($ +27%), the East ($ +12%) and the Midwest ($ +8%).
- Regional cider dollars increased YOY for the quarter in all regions.
What about 2020 as a whole? Here are some key points for cider’s off premise performance in Nielsen-measured channels for all of 2020:
- Off premise cider grew at +9.4% for the total category in 2020.
- Regional brands grew 33.4% in off premise channels in 2020.
- Cider, as reported by Nielsen, maintains its dollar share percentage as 1.2%. The category has hovered near this number for the last several years. To preserve those shares, cider has had to grow at a rate that keeps up with changes in the market, including the rise in flavored malt beverage sales.
The conclusion I draw from the data we’re gathering through our partnership with Nielsen is (1) Cider is still growing and (2) In 2021, we may see cider’s dollar share of the off premise beer market exceed 1.2%. This is in part a response to regional brands dominating the cider category for the first time and their long, unwavering history of double-digit growth.
Dive into flavor trends and more with the Members-Only Q4 Nielsen report here.
Now Available: Q3 Nielsen Reports

Complimentary custom, quarterly market trend reports are part of your American Cider Association membership. To access these reports at any time, sign into our login page. The landing page is full of helpful tools like our custom Nielsen reports and more.
Just looking to download Quarter 3? Log in and click here.
Q3 Highlights:
- The impact of the pandemic is stark. On-premise cider sales declined an estimated 40% when comparing 52-week periods and nearly 70% when comparing 12-week periods for the previous year.
- Total cider was up 10% for Q3 in off-premise channels measured by Nielsen. This does not make up for the massive pandemic-induced on-premise declines.
- Regional brands drove off-premise growth–up 34% vs national brand declines of 6%.
- Both on- and off-premise cider sales for regional brands are expected to eclipse national brand sales in Q4.
Find more insights by region, packaging and ingredients in our custom reports.
Q2 Nielsen Reports Ready For Download
One of the perks of combining our buying power as an association is that we can share valuable insights from Nielsen with you, our members.
You can now download our custom Q2 reports. In this data packet you will be able to access:
- Off-Premise Micro-Reports broken down for packaging type, flavor, and region–14 states and 6 regional outlooks. Available in both a 12-week and a 52-week outlook.
- Off-Premise Macro-Reports for Beer, FMBs and Cider. Available in both a 12-week and a 52-week outlook.
- On-Premise Reports for 6 metro markets.
- Nielsen PPT slide decks with charts, data visualization and insights on the cider category’s recent performance in both On- and Off-Premise.
- Bonus this quarter: Hard Seltzer off-premise report.
Here is an excerpt from a recent Nielsen survey about current overall consumer sentiment:
CONSUMER SENTIMENT REPORT SUMMARY BY NIELSEN
“Here are some high-level findings from a Nielsen survey of 18K+ consumers, fielded July 1-8, 2020.
- Since June, we have started to see some consistent trends not only for off premise alcohol, but also across many consumer good categories. That comes to life in consumer sentiment as well. 60% of households expect their routines to remain altered for at least the next 4 months
- Nielsen has shared insights in the past in several forms about how premiumization within off premise alcohol isn’t slowing down, and has in fact accelerated during COVID weeks. However, when it comes to total consumer goods, we are starting to see more cautious consumer sentiment in relation to spending. Approximately 4 in 10 (42%) of households say they are watching what they spend as a result of COVID.
- The homebody economy continues. When asked what % of time households eat meals or snacks at home versus outside of home, 39% of households said they ate 100% of their meals and snacks at home. An equal amount (39%) said they ate outside of their home only 10% of the time. As a comparison, when asked what their habits were prior to COVID, only 12% said they ate all of their meals at home.
- When asked what their plans are for the coming months, close to 1 in 3 households (28%) said they plan to eat all of their meals at home. That of course was lower for younger consumers age 21-34, and much higher for consumers age 65+.
- What about consumer plans if economic conditions get worse (recession and/or inflation)? When asked about things they would do to save money when shopping for beer or wine, 39% said they won’t change how they shop for it. However, nearly ¼ said they would buy less. That’s a slightly different story for households with lower income (<$30K), which said they would be more likely to stop buying it all together.”
Q2 2020 Nielsen Reports for Our Members
This content is for members only.
If you were a member and are now seeing this message, please Renew your membership to continue.
Cider: The Road Ahead


Every year around this time, we review the trends, changes, growth and challenges our industry faced in the prior twelve months. It’s a time to learn and respond. As your association, we do this to understand how U.S. companies are faring and to identify ways we can support the cider industry and its diverse members in the year ahead. No doubt, 2019 was challenging, but there is plenty of reason for optimism as we enter 2020.
YEAR IN REVIEW Despite strong head winds from growth in adjacent categories, the cider industry held ground in 2019.
2017 was the year we saw explosive growth for regional cider brands. 2018 was defined by the rosé trend. 2019 was a year of resilience. If you look at how fast the flavored malt beverage sector grew this past year, it’s quite impressive that cider performed as it did.
Over a two-year view from Q3 2017 to Q3 2019, off premise cider sales grew 6%. The rosé success of 2018 was an anomaly, and the come down from the trend is minor noise in the big picture. The cider category marches upward–sustainably. Many in the media may try to focus on pockets of decline in the market, but the fact is the wins outnumber the losses. Regional brands continue to see double-digit growth for off-premise sales across all flavor categories except pear. Stories of growth, success and rebounds are also found within national brands.
THE FUTURE 2020 is forecast to continue the beverage trends of 2019. Threats to our market share right now are fueled by a consumer desire for a drink that is refreshing, healthful, and light. Those three characters describe cider to a T. Somewhere cider lost that as part of our messaging, so this is an opportunity to remind people that cider is just that, and even better, it’s made from apples.
To help kickstart this messaging in the new year, we are highlighting 0g residual sugar ciders in our outward social media messaging for the month of January. We’re calling it Dry Cider January and we will be promoting the hashtag #pickdrycider. Our goal is to gain the attention of health-oriented consumers. Do you make a 0g residual sugar cider? Please tell us so we can include it on our list.
We’re developing additional campaigns to promote the diversity of cider and its relevance throughout the year. Cider is not a seasonal beverage, and there are many styles to enjoy.
THE DETAILS We’re proud to offer complimentary detailed quarterly market reports to our active members in partnership with Nielsen. The flavor, format and subsector comparisons are helpful for conversations with wholesalers and buyers. But the value of these reports shouldn’t overshadow the half of the equation unilluminated by them. Direct to consumer sales and indie retailers are not found in these reports, leaving many brands and success stories out of the Nielsen data. Our annual membership survey will be deployed in January. Please take a dozen or so minutes to complete it when you see our request. Cider data is hard to come by, and we are taking serious efforts to continue growing what data and information is available about the industry. Our membership survey is an important part of that.
So, what are the details for cider’s growth in 2019? We don’t have Q4 data yet, but here is what we do know for off-premise sales measured by Nielsen for 52-week period ending on 11/30/19. Total cider sales declined -3.9% in the channels measured by Nielsen, led by declines in some of the leading national brands. But also:
- Regional brand off-premise sales grew 15%
- Regional brand off-premise market share of the cider category grew from 29.4% for 2018 to 34% as of 11/30/19. (Dollar share)
What else do we know? This year we saw cidery acquisitions after not seeing any for some time. We also know that online sales through the vendor VinoShipper increased 9% in 2019. These changes represent different sides of the cider spectrum and demonstrate how intricate the cider ecosystem truly is.
Share your growth story with us. We want to know how you measured success in 2019. There will be many opportunities to reflect on 2019’s trends in our Marketing & Trends track at CiderCon® 2020. Meet us there!
RELEVANT Today, gluten-free is a common lifestyle, and cider continues to benefit from it. But cider is not just gluten-free. It’s light, crisp, refreshing, often low in or sugar free, and versatile. Low-ABV is a growing trend, and cider serves to benefit from this trend both with low-ABV ciders and with low-ABV cider cocktails. Both beer drinkers and wine drinkers are looking for lighter in flavor, lighter in body choices and our diverse category is greeting these drinkers with welcome arms.
I was at a party last week where there was no alcohol. It was a very 2019 moment, as we know more and more people are drinking less. But much to my glee, we spent about half the party discussing cider—how much people loved it, where to drink it, and exploring styles. Most people explained to me that they discovered cider due to health choices. I regretted not bringing cider to that party!
My point is that cider meets the criteria of today’s health-oriented consumer. This fact should be in all of our talking points next year, no matter what style of cider we make.
ROAD AHEAD Cider maintained its gains in a year of challenges. With the projections that we’re seeing for flavored malt beverages in 2020, it will be harder to do so next year. In light of these pressures, increasing direct-to-consumer sales is good for category and company health. If you don’t already vend online, make that your New Year’s resolution and attend ‘Clicks & Cliques: Tactics for direct-to-consumer channels’ at CiderCon®.
It may be tempting to feel competitive with our peers in the industry right now. If we stick together, celebrate our differences and diversity, and work united to share a message of category versality, healthfulness and cider pairing beautifully with food, we will surprise ourselves and our doubters. Good things come from working together.
The board and I look forward to working with our members in 2020. Let’s do this thing called cider!
Modified image Liz West by courtesy of CC license.
The Cider Rebound: Now, Let’s Keep It Going!
A recap of Nielsen’s keynote presentation at CiderCon 2019 in Chicago.
For the last three years we’ve been honored to have our partners at Nielsen present on the state of the cider industry during CiderCon’s opening session. They offer many of our members individual services, but we work with Nielsen to bring our members broad analysis that can help you with business pursuits and decisions. We are grateful for our partnership with Nielsen, and we hope that you will make sure you’ve sent them your labels and UPCs to enhance the value of this partnership.
We wanted to give you a quick recap of the points they delivered a week ago today. You can download their slides here: Nielsen Pres’n at CiderCon 2019_2-7-2019.
- Total off-premise (aka retail) sales were up 8.4% for the cider category in 2018.
- The category did over $500 million in off-premise sales last year.
- Cider retail sales dollars are 10x bigger today than 10 years ago.
- 40% of cider drinkers are between the ages of 21 and 29.
- Cider is the most gender balanced alcohol category, with 51% of drinkers being male and 49% of drinkers being female.
- Cider grew faster than beer, wine or spirits last year. Cider was edged out by Flavored Malt Beverage (FMB) growth, however.
- Cider is growing, but is still less that 1% of alcoholic beverage market share.
- The National Beer Wholesaler Association’s “Beer Purchasing Index” survey shows cider is an expanding segment with respect to distributor purchasing orders.
- Cider conversations online grew 11%–more than craft beer and alcoholic beverage category as a whole.
- Cider’s growth was led by nationally distributed rosé ciders (chiefly Angry Orchard and Crispin) and by regional/local brands.
- All 5 of American Cider Association’s geographical regions experienced positive growth in cider sales for 2018 (off-premise).
- Regional and local cider retail sales increased 23% in 2018 (local craft beer increased 9.3% in 2018).
- 23 brands exceed the $1MM retail sales mark AND had double digit gains in 2018.
- Regional/local cider is now 1/3 of cider retail sales.
- Off the top 25 cider brands, 17 of them are regional or local brands.
- Cider’s total sales rely more heavily on on-premise sales that the other sectors, which are all about 50/50 on/off-premise.
- On-Premise retail sales were down across the board for cider: draft/packaged, national/regional.
- Some growth was seen for citrus, stone fruit and fruit-combo flavored ciders.
- Cider sales are 4.5X larger than FMB sales in on-premise
- Cider drinkers visit on-premise establishments more often than beer drinkers, and cider drinkers spend more money.
- Nearly a quarter of cocktail drinkers age 21-34 report drinking cider cocktails.
- Cider share of Beer/FMB/Cider today (Off plus On Premise) is 1.6%today (dollars)
Nielsen closed with this challenge: What If Cider’s Share of Beer in U.S. increases by 1 point? U.S. Cider sales would increase +65%, (over $800MM more than today).
Contact speaker Danny Brager (danny.brager@nielsen.com) with your questions or to submit your labels for their database.
As a American Cider Association membership benefit, detailed Q1-Q3 on- and off-premise reports are available for just $50 per quarter. Contact Ellen@ciderassociation.org if you’d like to purchase any of these today. Q4 will be available shortly, to be followed by our annual report on the cider market.