Market Data
Webinar: The Story Within the Story of Cider

You’ve heard the headlines and the general trends for Cider. Join Brian “BK” Krueger and Dave Williams from Bump Williams Consulting on Tuesday, May 23, 2023 at 11:00 AM Pacific to dive in a little deeper and really take a look at the KPI’s that matter and how you can apply them to your own situation, presentations, insights, and decisions.
You can expect to hear more of the story on Cider Velocity, Runway for the Future, the Role of Flavor, Pack Size and Type, Innovation, Regional Power, and the Modern Bev Alc Consumer.
This webinar is for active ACA members only. Not a member? Join now!
Our Speakers

Brian “BK” Krueger graduated from the University of Texas, Austin in 1996 with a degree in Marketing – focusing on Strategic Marketing & Promotional Strategies. BK is a 24-year Industry Sales Leader with a distinguished and accomplished history of growth and development across multiple National and Regional Craft Breweries. Rising from New Belgium’s first “Texas Beer Ranger” in 1999, BK spent 17 years growing in parallel with New Belgium’s success and expansion and held the role of Assistant Director of Sales for 5+ Years. Leaving New Belgium in 2015, BK spent the next 4 years applying his knowledge, experience, and skill set to an extended selection of National and Regional Craft Breweries helping to evolve them into the modern and future world of Craft Beer. Joining Bump Williams Consulting in 2020, BK now applies his talents and expertise on Sales Systems and Structure, Portfolio Development, Distributor & Retailer Partnership, and Sales Strategy & Growth across the broad spectrum of Beverage Alcohol clients.

Dave Williams graduated from Penn State University in 2006 with a degree in Marketing. Dave began his career at Marketing Management Analytics (Ipsos MMA) as a Data Analyst, running sales regression models and market level analytics across various Retail and CPG clients. He left MMA and joined Nielsen in 2010, working up to the role of Client Manager. In this role, Dave led a team dedicated to Market Mix, Price/Promo and Consumer analysis for Procter & Gamble globally, spanning multiple categories and brands across their wide portfolio. In 2015, Dave left Nielsen to join Bump Williams Consulting where he currently runs high-end analytics across the Beverage Alcohol universe. His key focus areas include Consumer Behavior, Pricing, Promotion and Retail Landscape for BWC’s Supplier, Distributor and Retailer clients.
March 24 Coffee Chat with Vinoshipper

Join us March 24 at 9:30am for a Coffee Chat webinar with Vinoshipper!
Vinoshipper Senior Analyst Taylor Harrison will lead us through a look back at their data from 2022 and also provide a quick snap shot of what they’re seeing at the beginning of 2023 with regards to sales, packaging, and demographics!
Want to check out some of the data before Taylor’s presentation. You can download it here.
About Our Speaker

Taylor joined the alcohol industry directly out of college as in intern with Constellation Brands. Shortly after, he was awarded the ability to play lacrosse for Team England, so he moved to England, where he began working as a fine wine market analyst for the London International Vintners Exchange (Liv-Ex). During his summers, he would take time off to do vintage work at a winery in Surrey. Taylor joined Vinoshipper, from London, in 2021 and started up the data analytics program, offering insight into the craft alcohol industry. He continues to develop the division with the goal of helping producers make the most of their data and understand what is happening in the market.
Nielsen Q3 2022 Data Now Available


Regional Cider Brand sales were up 11.3% in U.S. retail channels measured by Nielsen for the 12-week period ending on October 1, 2022. For more Q3 data, log into your ACA membership account and visit our members-only report library.
New On Premise Data Reports from CGA

CGA has taken a deeper look at consumers’ recent behavior when it comes to On Premise beverage purchases. They shared these highlights of their recent research:
- On Premise visitation remains relatively static
- 33% are spending more per visit to a bar or restaurant vs. 18% spending less than they were three months ago – price increases have driven the increased spend
- Two in five expect to have to cut back on their future On Premise visits due to cost of living increases
It’s clear that inflation and lingering impacts of the pandemic are having an effect, but the good news is that 9% of bar and restaurant consumers reported cider as their beverage of choice in the last 3 months. Learn more with these reports from our partners at CGA.
Nielsen 2021 Data Insights Webinar

Nielsen 2021 Data Insights Webinar – April 27, 2022 at 11:00am Pacific
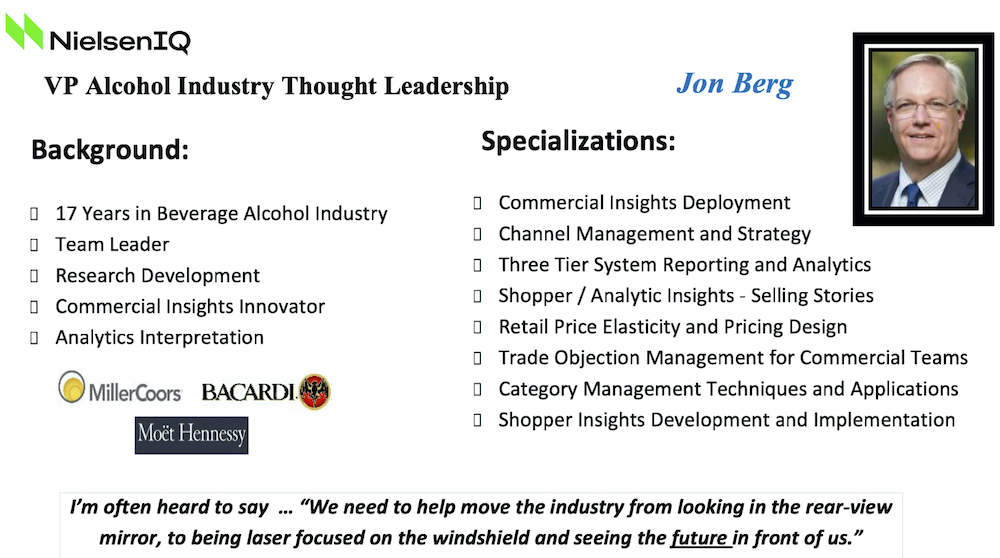
Join the ACA and Nielsen for a review of 2021 Off-Premise cider trends with Nielsen. Nielsen VP Jon Berg will share sales trends by packaging, flavor, style and region. We will also look at the insights provided by our newest report with Nielsen, a comparative consumer panel study. We’ll identify cider’s strengths and areas for growth regarding consumer demographics, and we’ll compare it to wine, beer, FMBs and cocktails.
About the Speaker
You must be an active ACA member to attend this webinar. You can join or renew your membership here.
Harvest Driven Cider Segment Survey Report Webinar
Join us March 1, 2022 at 12:00pm Pacific for analyses of the harvest driven cider segment of the cider industry. Harvest driven cider makers are defined as those for whom 75% of their annual cider production is are pressed once per year at or close to the date of harvest and are aged for a minimum of three months prior to packaging. Because this segment of the cider industry is often smaller producers who don’t sell in markets captured by Nielsen data or retail data scanner providers like IRI, the American Cider Association decided to launch an annual harvest driven cider survey. This inaugural survey was undertaken by Michael Uhrich of Seventh Point Analytic Consulting. He has taken a deep dive into the data to suss out the current status of the harvest driven cider segment and will present these results with us in this webinar.
This webinar is for ACA members only. You can log in, join, or renew your membership here.
Registration closes February 28, 2022 at 1:00pm Pacific. Information to join via Zoom will be sent after registration closes on February 28, 2022.
Webinar: BeerBoard’s Hard Cider Trends

BeerBoard’s Hard Cider Trends Webinar February 22, 2022
Join Dillon Card and Jim Randall from BeerBoard for the newest on-premise insights for cider with national and regional breakdowns, including competitive style and product performance data. This webinar will take place Tuesday, February 22, 2022 at 12:00pm Pacific on Zoom. Zoom link will be provided the day before the webinar.
This webinar is for active ACA members only. Join now or renew your membership!
Q3 Trends Available for Download


Q3 reports are available for download as part of your ACA membership benefits. Regional cider brand sales were up 11% for year over year comparisons of Nielsen-measured off-premise channels for the 52-week period ending with Q3. Total cider category sales for the 52-week period ending with Q3 were up 2% compared to 2019 and down 4% when compared to 2020 for Nielsen-measured off-premise channels. In on-premise channels, cider’s rebound for the 12-week period of Q3 compared to the same period for 2020 exceeded beer’s rebound for both draft and packaged sales. For more details on how the category is performing including regional and packaging analysis, download our members-only Nielsen reports after logging into our website.
Quarter 2: A Year After The Great Stockpile

Included in your benefits as an active member of the American Cider Association are quarterly market trend reports that break cider out into regions, packaging type, flavor, draft and more. Today we are releasing the Quarter 2 data provided through our partnership with Nielsen. Year over year comparisons for the second quarter of 2021 are not very helpful for most CPGs, because what were consumers doing in April, May and June of 2020? Stockpiling goods. Cider was no exception—according to Nielsen, retail sales of the total cider category were up 13.8% for Q2 of 2020 and regional cider brands were up a shocking 40%. So what can we say about Q2 of 2021 with the knowledge that Q2 2020 deserves an asterisk?
In Nielsen-measured retail channels:
- Regional brands of cider became the majority of cider’s market share in Q4 of 2020. That pattern persists in Q2 of 2021. These brands were only 25% of the market as recently as 2017.
- Regional cider brands are up 34.5% compared to Q2 of 2019. They are down slightly at -3.5% when compared to Q2 of 2020 which actually highlights what cider is best at: share preservation.
- Comparing YOY, regional cider brands are still positive for the trailing 52 weeks and will likely enjoy traditional Q3 seasonal growth.
- 6 packs of cans are the packaging type of choice for the moment.
- Flavors that are up for regional brands when compared to Q2 2019 include apple, pineapple, cherry, berry and sours, but the “other” flavor category is up 42% when compared to Q2 2019.
The data included in the Q2 packet compares to 2020. Keep that in mind when drawing your own conclusions. My conclusion is that cider is sustaining a big portion of the growth it saw in 2020 to preserve its share of the market. With regional cider brands comprising the majority of cider’s market share, we may start to see overall share growth in the context of the beverage alcohol segment.
Retailers who are taking cider off the shelf right now are missing a huge opportunity. Fall cider sets are a big winner—”From summer to fall of 2020, cider’s share of the beer category grew from 4.3 percent to 5.2 percent” (Drizly). I wonder what the increase is for regional cider? Probably much greater.
There is a lot of discussion of “nostalgic” flavors at the moment. This may be a chance for cider to push apple-driven products as we see brands like Seattle Cider and Bold Rock doing.
As far as the return of on-premise? When on-premise came back on board last spring, all “beer” segments experienced growth. We learned from our webinar last month that cider had the greatest YOY growth of all the “beer” sub-segments (*Q2 volume share Nielsen 12w 2021). National cider brands lead the growth, with a 751% increase for drafts sales for Q2 YOY. Apple-driven ciders experienced the most growth of all the flavor segments.
Cider won’t quit.
For more information on regional, packaging and flavor trends, get the Q2 data package included in your membership.
BONUS: For a fun analysis of GLINTCAP winners in the fruit cider category, check out this blog from Old Orchard.
Download Nielsen 2021 Quarter 2 Reports

This content is for members only.
If you were a member and are now seeing this message, please Renew your membership to continue.